Resizing a Numeric Column in a PostgreSQL Table without Changing Data

Drew Landis

While using PostgreSQL, you may find yourself in a situation where you have a column whose data type is now too small and the length needs to be increased. Updating a column type in PostgreSQL can, at times, be nothing short of very painful.

Let’s say you have a column of type varchar(25). When you first created the column, you decided there was absolutely no way you could ever need more than 25 characters in that column. Fast forward months or years later and you now realize that column requires 40 characters. This would be fine, except that (A) the table is huge - which means it could take a significant amount of time for this command to finish - and (B) there are views and rules that depend on that column - which generates errors when you try the standard ALTER TABLE my_table ALTER COLUMN my_column TYPE varchar(40);. There is no good solution to (A) other than waiting. Which may or may not be allowed based on your business needs. The solution to (B) is painfully manual. You need to drop all dependent views and rules (e.g. Primary Key, etc), make the column data type change, then recreate all dependent views and rules. This sucks.

Luckily, the folks over at sniptools.com solved this exact problem in this post. I won’t go into the details (you should look at the post directly), but suffice it to say, I have used their solution multiple times on a production database and it has worked amazingly well.

Great. Problem solved. …Except that now we have the exact same problem with columns of type numeric(precision, scale). I have a column of type numeric(2,0) and I really need it to be numeric(4,0). I’m running into all of the same problems as the varchar issue above.

Thankfully, there is a very similar solution! To demonstrate this, let’s start by creating a fake table of varying numeric types:

1
2
3
4
5
6
7
8
9
10
11
12
CREATE TABLE my_numeric_test(
numeric_one_zero numeric(1,0),
numeric_one_one numeric(1,1),
numeric_two_zero numeric(2,0),
numeric_two_one numeric(2,1),
numeric_three_zero numeric(3,0),
numeric_three_one numeric(3,1),
numeric_four_zero numeric(4,0),
numeric_four_one numeric(4,1),
numeric_fortyfive_fifteen numeric(45,15),
numeric_sixhundredeightythree_threehundred numeric(683,300)
);

Next, inspect the atttypmod of the different columns:

1
2
3
4
5
6
SELECT atttypmod, attname
FROM pg_attribute
WHERE 1 = 1
AND attrelid = 'my_numeric_test'::regclass
AND attname LIKE ('numeric_%')
ORDER BY atttypmod;

Notice, there is a pattern here:
atttypmod = precision * 65,536 + scale + 4

Let’s say we want to update column numeric_four_zero to have type numeric(9,0). A couple of tests:

1
2
INSERT INTO my_numeric_test (numeric_four_zero) VALUES (1234); -- works!
INSERT INTO my_numeric_test (numeric_four_zero) VALUES (123456789); -- ERROR: numeric field overflow

Using the algorithm from above, for numeric(9,0) we see atttypmod = 9 * 65,536 + 0 + 4 = 589,828. Here is how we can update the column type:

1
2
3
4
5
6
7
8
-- Regular way to update column type (don't use this for this example...)
--ALTER TABLE my_numeric_test ALTER COLUMN numeric_four_zero TYPE numeric(9,0);
-- Hack way to update column type
UPDATE pg_attribute
SET atttypmod = 589828
WHERE attrelid = 'my_numeric_test'::regclass
AND attname = 'numeric_four_zero';

We can run the same test as above and see that it works:

1
INSERT INTO my_numeric_test (numeric_four_zero) VALUES (123456789); -- works!

We can also select the column from the table and see that the column type has changed:

1
SELECT * FROM my_numeric_test;

Finally, cleanup:

1
DROP TABLE my_numeric_test;

Warning: I’m not sure if there are any side effects of doing this on your own code. I think it should work, but give no guarantees implicitly nor explicitly that it will not turn your database into a smoking, ruined heap.

Again, many thanks to this sniptools post. Without them, it would not have been possible.

Hope that helps!

Update (Sept 19, 2016):

I was too worried about potential side effects of using this hack and opted to not use it on a production environment. Instead, I dropped 80 views, updated about 65 column data types, and then recreated the 80 views. It required lots more work, but this way, I’m more confident in the final product. As stated before, if you do use this hack, do so at your own risk.

SQL Lateral Joins

Drew Landis

Recently, I heard about a relatively new (as of 9.3) feature in Postgres called a LATERAL JOIN. A LATERAL JOIN enables a subquery in the from part of a clause to reference columns from preceding items in the from list (quoted from here). Without LATERAL, each subquery is evaluated independently and so cannot cross-reference any other from item (quoted from here).

I’ve been looking for a good way to use this feature in our internal code and I finally found one. In our specific instance, using a LATERAL JOIN sped up a query by an order of magnitude! However, our example was relatively complex and specific to us, so here is a generic (very contrived) example.

Setup:

1
2
3
4
5
6
7
8
9
10
11
12
13
14
15
16
17
18
19
-- Create a table with 10 million rows of 6 character random strings of numbers
-- takes about 30 sec to create
CREATE TABLE rand_table AS
SELECT
id,
LPAD(FLOOR(RANDOM()*1000000)::text, 6, '0') AS rand_string
FROM GENERATE_SERIES(1,10000000) id;
-- Create table with 999,999 rows of 6 character strings of numbers (from 1 to 999,999)
-- takes about 1 sec to create
CREATE TABLE series_table AS
SELECT
id,
LPAD(id::text, 6, '0') AS series
FROM GENERATE_SERIES(1,999999) id
-- Vacuum analyze both tables
VACUUM ANALYZE rand_table;
VACUUM ANALYZE series_table;

Test:

Let’s count how many instances of '010170' there are in rand_table. Then we’ll LEFT JOIN that to the series_table. Like, I said, super contrived…

1
2
3
4
5
6
7
8
9
10
11
12
13
14
15
16
17
18
19
20
21
22
23
24
25
26
27
28
29
SELECT
st.id AS series_id,
st.series,
rt.count
FROM series_table st
-- Fast query (using a LATERAL JOIN) ~2 seconds
/*
LEFT JOIN LATERAL (
SELECT
rand_string,
COUNT(rand_string)
FROM rand_table
WHERE rand_string = st.series -- this is the lateral magic!
GROUP BY rand_string
) rt ON st.series = rt.rand_string
*/
-- Slow query (using a regular JOIN) ~10 seconds
/*
LEFT JOIN (
SELECT
rand_string,
COUNT(rand_string)
FROM rand_table
GROUP BY rand_string
) rt ON st.series = rt.rand_string
*/
WHERE st.id = 10170

Clean Up:

1
2
DROP TABLE rand_table;
DROP TABLE series_table;

Results:

The LATERAL JOIN returns results in about 2 seconds, while the regular JOIN takes about 10 seconds.

In the slow (LEFT JOIN) query, the subquery is forced to return all data, and then JOIN on that entire result set. It takes a long time to grab and count the entire result set of the subquery, which considerably increases the overall query time. In the fast (LEFT JOIN LATERAL) query, the subquery is able to reference the st.series column from a preceding item, and pare down the subquery result set to only include data that will ultimately be JOINed upon.

As stated, this example is super contrived and there are definitely other ways to rewrite and improve it, but hopefully this will give you the gist of how a LATERAL JOIN should look and function. Also note, this query speed only improved by about 5 times, however for our internal query, we were able to improve query time by an entire order of magnitude. Depending where you use LATERAL JOINs, some queries will improve more than others.

Hope that helps!

Update (July 15, 2016):

I updated the above test so that rand_table has 100 million rows of 7 character numeric strings, and series_table has 9,999,999 rows of 7 character numeric strings, then re-ran the test. This time, the LATERAL JOIN finished in about 44 seconds and the regular JOIN finished in about 20 minutes and 45 seconds (–> 1,245 seconds). This means that the LATERAL JOIN completed the query 28 times faster than the regular JOIN!

Monitoring PostgreSQL Replication Lag with Monit

Dylan Wood

For some time, we have been utilizing PostgreSQL’s hot standby replication feature in both our staging and production environments. Currently, the hot standby serves three functions:

  1. Standby server for maximum uptime if the master fails.
  2. Disaster recovery if the master fails completely.
  3. Read-only batch operations like taking nightly backups.

All three of these functions are critical to the safety of our data, so we need to be sure that the master and slave are properly communicating at all times. We use MonitMonit and M/Monit for most of our application and server monitoring. Monit is a daemon that runs on each of our servers, and performs checks at regular intervals. M/Monit is a centralized dashboard and alert service to which all of the Monit instances report. To help ensure that we get alerts even if our network is completely offline, our M/Monit host is hosted by AWS.

Because replication is so important, I have taken a belt and suspenders approach to monitoring the replication lag. This means that Monit is checking the replication status on both the master and the slave servers. The approach uses Monit’s check program functionality to run a simple python script. If the script exits with an error (non-zero) status, then Monit will send an alert to our M/Monit server. M/Monit will then send emails and slack notifications to us.

On to the code:

On the master server:

/etc/monit/conf.d/pg-master-replication-check

1
2
3
4
5
check program replication_check
with path "/coins/pg-monitoring/master-replication-check.py"
as uid "{{postgresql_service_user}}"
and gid "webadmins"
if status != 0 for 3 cycles then alert

/coins/pg-monitoring/master-replication-check.py

This script queries the database to ascertain that it is in the right state (WAL streaming), and that the replication position reported by the slave is in line with that expected by the master.

1
2
3
4
5
6
7
8
9
10
11
12
13
14
15
16
17
18
19
20
21
22
23
24
25
26
27
28
#!/usr/bin/python
import subprocess
repLagBytesLimit = 128
try:
repModeRes = subprocess.check_output('psql -t -p {{postgresql_port}} -c "SELECT state FROM pg_stat_replication"', shell=True)
isInRepMode = repModeRes.strip() == 'streaming'
repLagRes = subprocess.check_output('psql -t -p {{postgresql_port}} -c "SELECT pg_xlog_location_diff(sent_location, replay_location) FROM pg_stat_replication"', shell=True)
repLagBytes = float(repLagRes)
except subprocess.CalledProcessError as e:
print "Error retrieving stats: {0}".format(e)
exit(1)
if isInRepMode != True:
print ('Master server is not streaming to standby')
exit(1)
if repLagBytes > repLagBytesLimit:
print 'Slave replay is lagging behind by %f bytes' % repLagBytes
exit(1)
print('All clear!')
exit(0)

On the slave server

/etc/monit/conf.d/pg-slave-replication-check

1
2
3
4
5
check program replication_check
with path "/coins/pg-monitoring/slave-replication-check.py"
as uid "{{postgresql_service_user}}"
and gid "webadmins"
if status != 0 for 3 cycles then alert

/coins/pg-monitoring/slave-replication-check.py

This script queries the database to ascertain that it is in the right
state (recovery). It also queries the current xlog position from the master,
and compares it to the last reply location of the slave.

1
2
3
4
5
6
7
8
9
10
11
12
13
14
15
16
17
18
19
20
21
22
23
24
25
26
27
28
#!/usr/bin/python
import subprocess
slaveXlogDiffLimitBytes = 128
try:
repModeRes = subprocess.check_output('psql -t -p {{postgresql_port}} -c "SELECT pg_is_in_recovery()"', shell=True)
isInRepMode = repModeRes.strip() == 't'
masterXlogLocationRes = subprocess.check_output('psql -t -p {{postgresql_port}} -h {{postgres_basebackup_host}} -U {{postgres_basebackup_user}} {{postgres_db_name}} -c "select pg_current_xlog_location();"', shell=True)
masterXlogLocationStr = masterXlogLocationRes.strip()
slaveXlogDiffRes = subprocess.check_output('psql -t -p {{postgresql_port}} {{postgres_db_name}} -c "select pg_xlog_location_diff(pg_last_xlog_replay_location(), \'' + masterXlogLocationStr + '\'::pg_lsn);"', shell=True)
slaveXlogDiffBytes = float(slaveXlogDiffRes.strip())
except subprocess.CalledProcessError as e:
print "Error retrieving stats: {0}".format(e)
exit(1)
if isInRepMode != True:
print ('Slave server is not in recovery mode')
exit(1)
if slaveXlogDiffBytes > slaveXlogDiffLimitBytes:
print "Slave server replication is behind master by %f bytes" % slaveXlogDiffBytes
exit(1)
print('All clear!')
exit(0)

You may wonder why I chose python instead of Bash or my usual favorite: Node.js. Python is installed in our base server image, while Node is not, and I want to keep out database servers as stock as possible. I chose python over bash because I find that bash scripts are brittle and difficult to debug.

Launching a Console in VMware Web Client on Windows 10, Chrome 42+

Dylan Wood

Maybe it is just me, but I had a difficult time launching the console of my
guest VMs using the VMware Web Client. Here is how I eventually got it working
on Windows 10 and Chrome 43.x.

Launch VMWare Web Client

Background

I am a huge fan of VMware’s plan to replace their Windows-only vSphere desktop
client with a web client. Using the web client, I am able to perform
most tasks directly from my Mac, thus saving the time of booting a Windows VM.
The only task which cannot be performed in the web client from OS-X is launching
the guest OS console.

In order to open the console in the web client, it is necessary to install the
VMware Client Integration Plugin, which VMWare claims is only available for
64/32-bit Windows and 32-bit Linux. I was unable to get the Client Integration
Plugin to install on Ubuntu 14.04, so it looks like I am still stuck using a
Windows VM to manage our VMware cluster.

Even on Windows, it took some time to get things configured such that I could
access a guest VM’s console via the web client. Here is how I eventually did it.

Environment

  • OS: Windows 10 Evaluation Copy
  • Browser: Google Chrome 43.0.2357.130 (Tried IE Edge and Firefox with no luck)

Install Client Integration Plugin

  1. Navigate to your VMware Web Client login page in your browser. Do not log in.
  2. Click the link at the bottom left of the page entitled ‘Download Client Integration Plugin’.
  3. Run the downloaded installer, accepting all defaults.

Enable NPAPI plugins:

  1. Paste chrome://flags/#enable-npapi into your address bar and press return.
  2. Click Enable below Enable NPAPI.
  3. Click Relaunch Now at the bottom left of the page.

Allow VMware plugins to run

  1. Paste chrome://plugins/ into the address bar and press return.
  2. Check the box next to ‘Always allow to run’ below both VMware plugins.

Verify plugins

  1. Restart the windows machine for good measure.
  2. Open Chrome and navigate back to your VMware Web Client login page.
    You should see two notifications from chrome at the top of the page (see image below).
    These notifications can be disregarded (for now, see discussion further below).plugin_warnings.png

Still does not work?

If you do not see the warnings from Chrome, try this:

  1. Navigate to chrome://settings/content
  2. Scroll to ‘Unsandboxed Plugins’
  3. Select ‘Allow all sites …’
  4. Click ‘Done’
  5. Repeat the Verify plugins steps above.

Open the console for a VM

  1. Log in to the VMware Web Client
  2. Locate a VM whos console you want to open
  3. Click the Settings tab
  4. Near the top of the center pane, you should see a black square with the text Launch Console beneath it. If you see a link to Download plugin instead, something
    is wrong. Try repeating the steps above.

Discussion about NPAPI plugin support

Google has promised to completely remove NPAPI plugin support from Chrome with
version 45. Given the approximate 5-week release schedule that Google has been on,
this means that you will only be able to use the most recent version of Chrome
with the VMware Client Integration Plugin for another couple of months.

With this in mind, I am going to keep my vSphere desktop application installed.
Hopefully, VMware has already begun work on a truly cross platform Web Client
that supports launching a console.

Managing Application Dates and Times

Christopher Dieringer

Note: this is a repost from cdaringe.net

Managing date and times has long been trouble for every application developer. In many cases, a simple app only cares about datetime resolution at the day level. However, to many applications, higher time resolution is critical. In these applications, a finer, more granular time-unit resolution may be highly desirable. The difficulties in managing time emerge in the realm of relativity. If an application, its users, and its dependent infrastructure are spread across timezones, synchronizing a chronological history of events may prove difficult if you haven’t designed your system to manage time full well. This is discussion may be old hat for many, but a painful reality for many apps.

Time After Time...

why is it difficult?

It doesn’t have to be, actually. The “difficult” aspects of managing time are generally designer oversight. Two common oversights that I am personally guilty of are:

  • Time is often captured incompletely. Application services consuming the incomplete time fill in the missing data with assumptions.
    • ex: in js, (new Date()).getTime() //=> 1435089516878. What happens if you log this time on a server in a different timezone? Most likely, the server uses its timezone or UTC, not the user’s time zone.
  • Time is transferred in varying formats, generating sub-system overhead (or errors!)
    • How do you serialize your date or time objects for sending over the wire? Is your serialization lossy? Do your services require knowledge of each others’ formats?

how do we fix it

Before we discuss how these issues manifest themselves in an application, let’s quickly discuss the general solution. We need a solution to represent time that does so reliably across:

  • distributed application environments (e.g. languages, operating systems, clients)
  • distributed application hardware
  • client time zones

My preferred strategy is to store, transfer, and manipulate complete timestamps only. What’s a complete timestamp? It’s simply an absolute time with visual representation of timezone. It’s a string or composite datatype specifying time with my application’s required time-unit resolution or finer, + TZ. Practically speaking, in my app I will:

  • store all database times as timestamp with timezone (or equivalent)
  • transfer all times as fully defined time strings with timezones in a standardized format (e.g. ISO 8601). Know your application’s time-wise resolution needs, and adhere to them throughout the app. Suppose you need second level resolution:

    • bad: ‘10/25/2010’
    • bad: ‘10/25/2010 08:23:22’
    • good: ‘10/25/2010 08:23:22-07’
    • good: ‘10/25/2010 08:23:22.2324-07’ (note timezone offset always included)
  • perform time operations only through utilities that can parse and understand the complete time strings. avoid manually extracting time components out of strings.

application date and time oversights

We already discussed these above. Let’s dive a bit deeper.

time captured incompletely

Earlier, we examined computing unix time in the browser, using javascript.

1
2
var myDate = new Date();
myDate.getTime(); //=> 1435089516878`

The above is an easy way to get a time. Let us use this in our app, so long as that time data doesn’t leave this client, or this machine doesn’t change timezones. Can you assert that your user’s don’t travel? Can you assert that your time or time calculations won’t be sent somewhere, beyond the client? If you cannot, sending time in a basic integer format drops critical data. Specifically, you lose timezone relativity and, in rare cases, a known base-time reference value. For instance, does that integer reflect the # of seconds from unix-time-start in UTC time, or the # of seconds from unix-time-start, offset for your region?

You could, as some do, use the above integer time value in conjunction with a timezone string. However, you’ve introduced generally 1 to 2 steps of extra parse complication on all services consuming your time values, and an unstated assumption that the unix time provided is already aligned with UTC (it generally is). These are all simple concepts that stack up to be a complicated when you have many services in different languages. JS (node and browser), for instance, default to milliseconds. PHP likes seconds.

Managing this complication is generally unnecessary. In order to convey a clear, accurate, and complete timestamp, one of which that you can interchange safely across services, serialize your apps’ and services’ timestamps in a complete string during I/O, and parse via language natives or time helper libraries as required.

1
2
3
4
5
6
7
8
9
10
11
12
13
14
15
16
17
18
// client makes xhr GET request to server
xhr.get(..., cb);
// server responds (ex. php DateTime)
$datetime = new DateTime('now', new DateTimeZone('America/Los_Angeles'));
echo $datetime->format('c'); // 2015-06-24T09:45:06-07:00
(ISO 8601)
// client parses. (ex. javascript moment.js)
var cb = function(response) {
// response => 2015-06-24T09:45:06-07:00
var myDate = moment(response);
myDate.format(); // 2015-06-24T09:45:06-07:00
myDate.toISOString(); // 2015-06-24T16:45:06.000Z
// how refreshing! all I/O could use `.format()`
// as your serialized version, instead of `.toISOString()`
// so as to not drop user TZ
}

This example leads us directly to our next topic!

time is transferred in varying formats

Look at your own applications. How have you shared times between services? Have you echoed time values directly out of your database? Have your API’s used programming-language specific formatting functions to make time “look” standard to your liking?

Apps I have worked in have done all sorts of variants in php:

1
2
3
4
echo date("Ymd"); // or
echo date(DATE_RFC2822); // or
echo date("Y-m-d H:i:s"); // very prevalent in codebases i've used
echo date("c"); // my favorite :), e.g. 2004-02-12T15:19:21+00:00

date(“c”)?

Use a standard. 8601 is my personal preference. Using a standard is generally the safest, as most languages have a toolset that can parse and manipulate dates/times from a standardized string. It is ideal to do date/time I/O in the same string format on every transfer to make your interfaces predictable!

A consideration that must not be overlooked is whether or not the timestamp serializer normalizes to UTC or not. In the server example directly above, we used date("c"). This does not normalize to UTC time. In the client example, we advised against using myDate.toISOString() in favor of myDate.format(), where .toISOString() normalized to UTC. Again, all of the above variations are 8601 compliant, but .toISOString() drops user +TZ data.

It can be OK for servers to send outbound timestamps normalized to UTC time if:

  • we have a centralized server model (because we tend to normalize internally against UTC anyway) AND,
  • our client apps/services don’t care about client locale history

Those are tough bullets to gamble over. You may have not know how your app or ecosystem will change in time. In a distributed server model, where server activity also needs to be tracked against other servers, UTC normalization may lead to bad consequences! Don’t normalize to UTC if you have rich TZ data to begin with and there is possibility that you will want to maintain client locale time in any part of your app!

summary

It’s easy to drop critical time data. It’s also very easy to maintain good timestamp data integrity. When possible,

  • clear understanding your app’s timestamp requirements,
  • use a timestamp standard,
  • avoid time normalization, and
  • practice lossless timestamp serialization and parsing.

These tips will help yield a healthy app and good time intgrity. It’s a bland topic–thanks for reading!

moment.js

php DateTime

Note: FF bug: Date.parse doesn’t honor valid ISO str, hence moment.js usage for unified x-browser time-parsing experience!

How to [partially] retreat from a database upgrade

Dylan Wood

This post has turned into a bit of a long story.
If you are just looking for how to perform a pg_restore from a newer version of PostgreSQL to an older version of PostgreSQL, look down toward the bottom.

We recently upgraded our worn-out PostgreSQL 8.4 database running on a Cents 5.5 VM to a shiny new PostgreSQL 9.4 database on top of Ubuntu 14.04.
During a three week testing period, we encountered and fixed a coulple of upgrade-induced bugs in our staging environment.
At the end of three weeks of testing, we felt confident that the upgrade would go smoothly in production… and it did (mostly).

The day after the upgrade, users started to submit tickets complaining that our data export tool was running very slowly in some cases, and just hanging in other cases.
Myself and two other engineers spent the next day and a half benchmarking the new database servers over and over, and looking at Explain Analyze plans.
Eventually, we convinced ourselves that the issue was not with the underlying virtual machine, or the OS, but with our configuration of postgres.

To better debug, we restarted our old database server, and ran the offending queries there as well as in the new server in our staging environment.
We were able to gain some insights into the issue by comparing the Explain Analyze output from both servers:
The new database was not using the same indices that the old database was. This resulted in more nested loops and analyzing more rows than necessary.

By increasing the random_page_cost from 4 to 15, we were able to get the query explain plans to look more similar, but performance did not improve.
The new database was still choosing different indices to scan.

At this point, our users had been without a useful query-building-export tool for two business days, so it was time to switch tactics and implement a work-around solution.
I decided that it would be easiest to direct the queries used by our export tool to a copy of our old production database.
We would be able to keep the copy relatively up to date by loading nightly backups from our production infrastructure.

Modifying the application layer to send requests to the old database server was trivial, since there was a dedicated endpoint just for the low-performig export tool.
Getting the old database to refresh from a backup of the new database was a little trickier.

First, I set up a cron job to run a pg_dump on our hot standby database server every night, and store the dump on our network storage.
I have always used the custom format (-Fc) for pg_dumps, as they allow a lot of flexibility when performing the restore.
This was not an option in this case because I received the following error when trying to restore on the PG 8.4 server: pg_restore: [archiver] unsupported version (1.12) in file header.

My initial attempts to circumvent this included running the pg_dump of the new database remotely from the old database server unsuccessfully, and attempting to upgrade only postgres-contrib on the old database server.
Neither of these solutions worked out, so I decided to use the plain pg_dump format (-Fp). This outputs plain SQL statements to rebuild the schema and data.
There are still a few errors during the restore, because the CREATE EXTENSION functionality does not exist in PG 8.4, but I can simply rebuild the necessary extensions manually after the rebuild.

To reduce the time taken by the dump and restore process, I only dump the schema used by the export tool.
In addition, I omit all history tables (a construct we use to track changes made to data in the database) and some of the larger tables not used by the query tool.
This also reduces the size of the restored database considerably, and allows me to restore into a temporary database while the primary database is still running, allowing for near-zero downtime.

A simplified diagram of the current system is shown below:
QBPG84.png

Here is the cron task that dumps the data. This is placed in its own file in /etc/cron.d

1
30 23 * * * postgres pg_dump -vFp -p 6117 -T 'mrsdba.mrs_series_data' -T '*_hist' -T mrsdba.mrs_series -T mrsdba.mrs_analysis_files -T mrsdba.mrs_assessment_events -T mrsdba.mrs_asmt_resp_hist_new -n 'mrsdba' postgres > '/coins/mn t/ni/prodrepdbcoin.sql' > /tmp/rep_dump.log 2>&1

Here is the script that creates a new Postgres 8.4 DB from the dump of the Postgres 9.4 database.

1
2
3
4
5
6
7
8
9
10
11
12
13
14
15
16
17
18
19
20
21
22
23
24
25
26
27
28
29
30
31
32
33
34
35
36
37
38
39
40
41
42
43
44
45
46
47
48
49
50
51
52
53
54
55
56
57
58
59
60
61
62
63
64
# Author: Dylan Wood
# Date: June.20.2015
# Script is called from /etc/cron.d/coins_query_restore
echo 'Starting COINS DB refresh as user:'
echo `id`
echo `date`
# Define variables
ARCHIVE_DIR="/export/ni/prodrepdbcoin.sql"
ARCHIVE_FILE=`ls -1t $ARCHIVE_DIR | head -1`
DBNAME="postgres"
DBPORT=6117
# Create temp database
# Create empty DB
echo 'Creating empty DB'
createdb -p $DBPORT ${DBNAME}_temp
# Create lang
echo 'create plpgsql lang'
psql -p $DBPORT -d ${DBNAME}_temp -c 'CREATE LANGUAGE plpgsql'
# Restore DB
echo 'restoring db from latest dump'
psql -p $DBPORT -d ${DBNAME}_temp -f $ARCHIVE_FILE
# Edit default search path
echo 'Setting default search path'
psql -p $DBPORT -d ${DBNAME}_temp -c "ALTER DATABASE ${DBNAME}_temp SET search_path=mrsdba, casdba, public;"
# Truncate qb temp tables
echo 'Truncating QB temp tables'
psql -p $DBPORT -d ${DBNAME}_temp -c "TRUNCATE TABLE mrsdba.mrs_qb_asmt_data_sort_temp; TRUNCATE TABLE mrsdba.mrs_qb_asmt_pivot_categories_temp;"
# Add empty schemas
echo 'Adding casdba, dxdba and dtdba'
psql -p $DBPORT -d ${DBNAME}_temp -c "CREATE schema casdba; CREATE schema dxdba; CREATE schema dtdba;"
# Create tablefunc extension
echo 'Create tablefunc extension'
psql -p $DBPORT -d ${DBNAME}_temp -f /usr/share/pgsql/contrib/tablefunc.sql
# VACUUM ANALYZE THE DB
echo 'VACUUM ANALYZE'
psql -p $DBPORT -d ${DBNAME}_temp -c "VACUUM ANALYZE"
# Drop database
# First, disconnect all connections
echo 'Terminating connections to DB'
psql -d $DBNAME -p $DBPORT -c "SELECT pg_terminate_backend(procpid) FROM pg_stat_activity WHERE procpid <> pg_backend_pid() AND datname = '$DBNAME';"
# Drop DB
echo 'Dropping DB'
dropdb -p $DBPORT $DBNAME
# Rename temp DB
echo 'Renaming temp database'
psql -d habaridb -p $DBPORT -c "ALTER DATABASE ${DBNAME}_temp RENAME TO ${DBNAME};"
echo 'Finished with COINS DB refresh'
echo `date`

Standardizing PostgresSQL Instances

Dylan Wood

COINS uses a centralized PostgreSQL database. We have been so busy developing new features that we have not upgraded the database used by the COINS production application since 2010!
New feature requirements and a need for increased disk space on our production server are finally motivating us to upgrade to PostgreSQL 9.4.
While we are at it, we will upgrade the underlying virtual host to Ubuntu Server 14.04, with enough RAM to fit our rapidly growing datbase in memory.
Finally, it makes sense to lay some ground work to clean up our inconsistent use of database names and ports.

Summary of changes:

Current Value New Value
OS CentOS 5.5 Ubuntu Server 14.04
DBMS PostgreSQL 8.4.5 PostgreSQL 9.4.2
RAM 16GB 48GB
CPU Cores 4 4
Recovery Nightly pg_dump WAL archiving for PITR (managed by PG Barman
Replication Daily pg_restore from nightly pg_dump Hot Standby w/ WAL shipping
COINS DB name postgres coins
Port 6117 5432
Hostname tesla.mind.unm.edu proddbcoin.mind.unm.edu
Connection Pooling none pgbouncer

Justification

Operating System

CentOS has served us well for many years, but we have found that Ubuntu’s more up-to-date repositories allow us to stay with the herd as new features are released in packages we depend on (e.g. PostgreSQL, PHP5, Node.js, etc…)

Postgres

Simple: 8.4 is no longer supported. Also, new JSON functionality is really nice (e.g. row_to_json).

RAM

When our current production database server was provisioned, 16GB was enough ram to hold two copies of the COINS database. The database is currently 24GB on disk, and growing fast. 48GB should buy us a little time.

CPU Cores

Postgres does not do anything special for multi-core environments. Instead, it relies on the operating system to destribute its child processes across the cores evenly. Our database has never been CPU bound, so we see no need to increase the number of cores at this point.

Disaster Recovery and Backups

We currently have a cron which performs a pg_dump of the production database every night, and stores the dump on our internal network storage at MRN. In the event of a total loss of our database server, we would be able to recover all changes made before midnight on the day of the failure. Utilizing WAL archiving will allow for Point in Time recovery, and could allow us to salvage data and changes made only minutes or seconds before the outage. In addition, it lays the ground work for a geographically distributed recovery system.

Replication

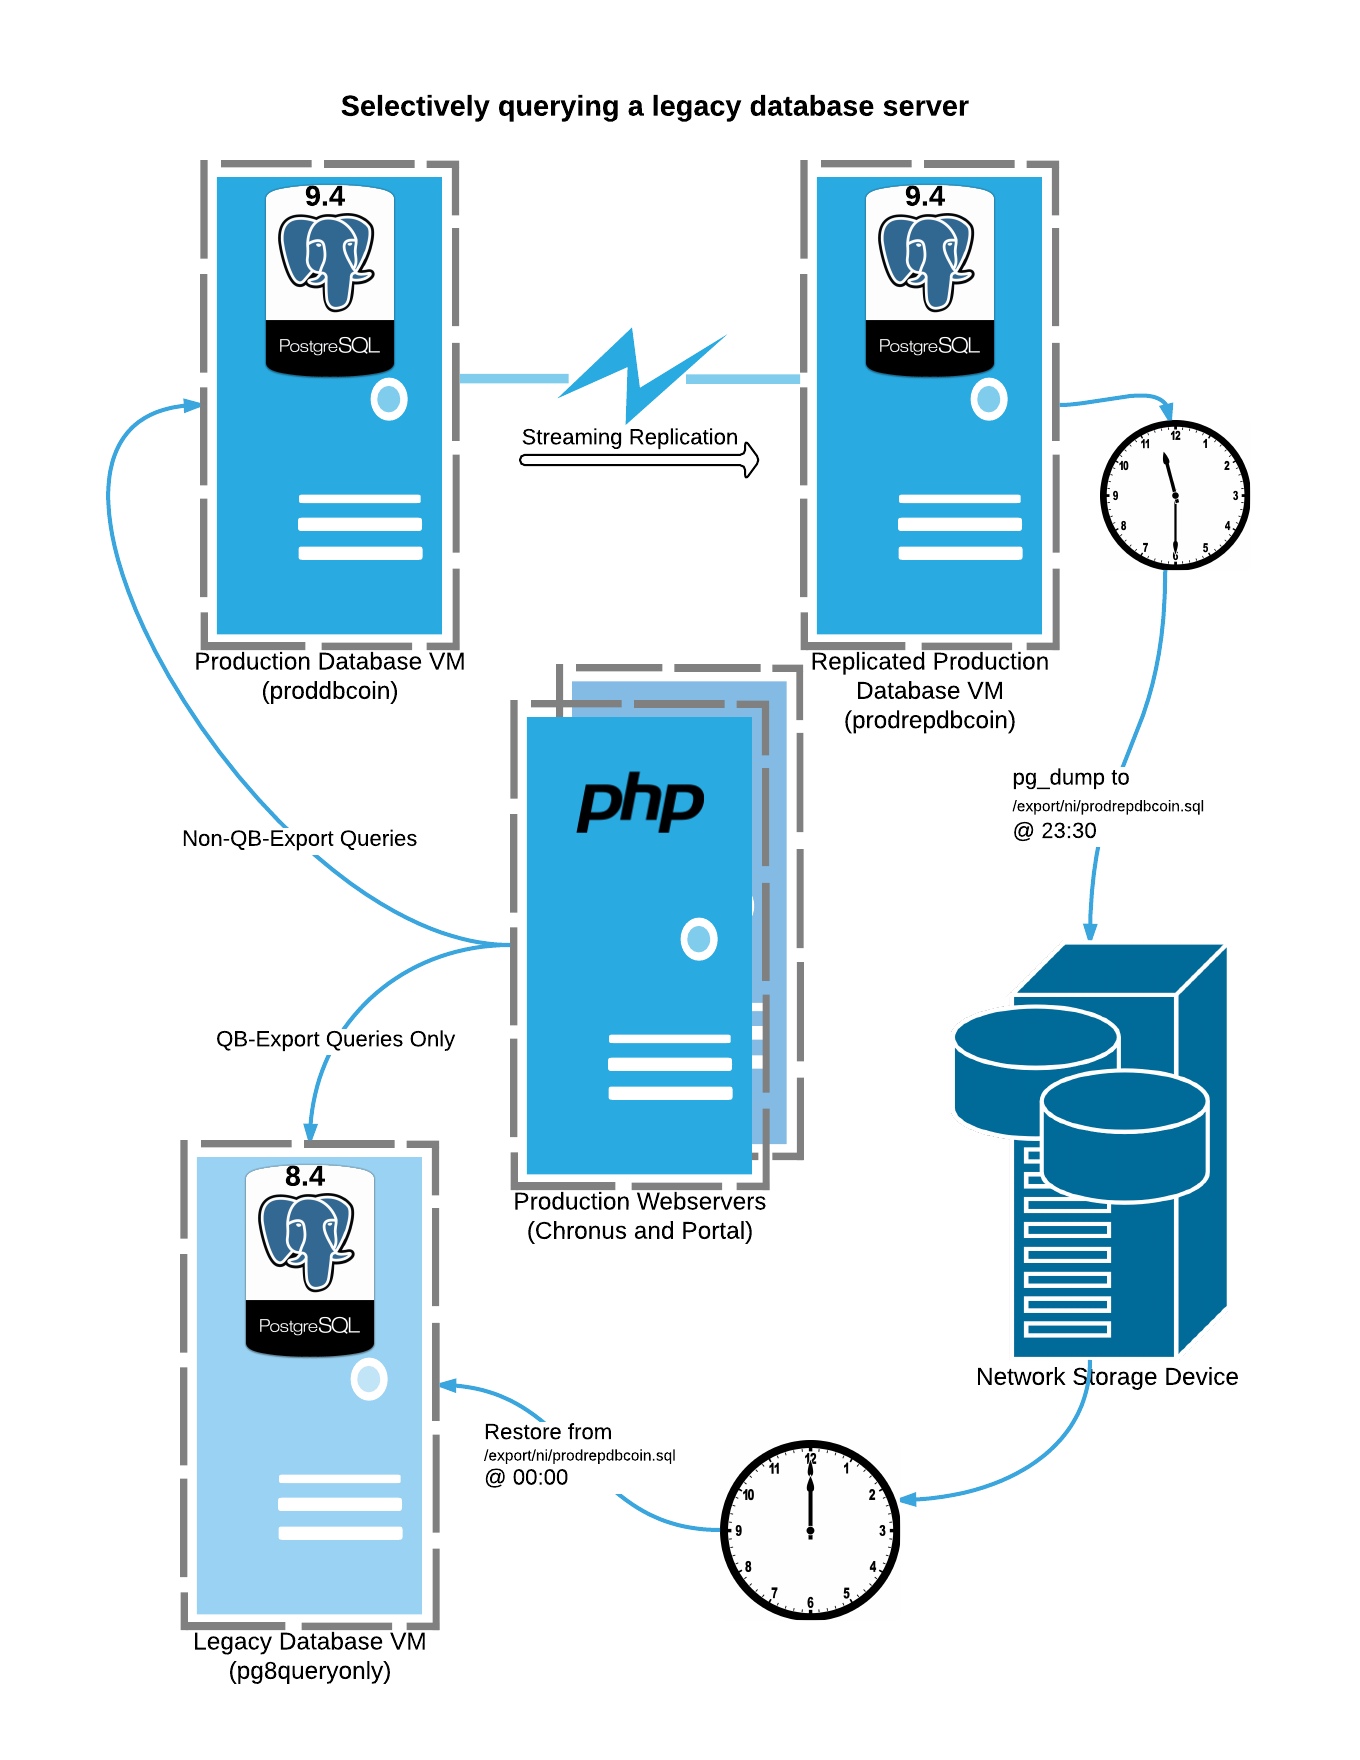
In order to get COINS running as soon as possible after an outage, we have another production-ready database server running at all times. This database is refreshed every morning from the previous night’s pg_dump of production. Unfortunately, if the production database were to fail, users would loose access to data entered after the last pg_dump. Further, if we were able to salvage the data entered between the last pg_dump and the outage, we would need to somehow merge all of that data with data entered into the replication database after the outage.

The new system uses WAL streaming to replicate all changes made in production (even schema changes!). In the event that the production database were to fail, the replication database would likely be only a few records behind the production database. Aside from loosing much less data in the event of a failover, there are other benefits to having a nearly up-to-date copy of production lying around at all times:

  • Backups can be made of the replication database, thus reducing the load on the production server during backup times
  • The replication database can be configured to handle read-only queries, further reducing the load on the master production database, and decreasing query time.

Database name

Back in 2010, the COINS team migrated from an Oracle Database to PostgreSQL. Our understanding of Postgres was still very limited, and we made some poor design decisions. One of these decisions was to use the default maintenance database as our primary DB. This does not directly cause any problems, but is generally a bad practice.

There are at least one dozen devices spread across the United States that connect to our production database, and rely on the current database name. Changing all of these touch points in a single go would be stressful and very risky (even after practice, and lots of planning, we could still miss or break a few devices). Updating the devices one at a time to utilize the new database name is therefore much more favorable. Doing so will allow us to cooperate with the device owners to come up with a time that will not negatively impact their work.

The problem is: a Postgres database can only have one name and one port. We can overcome this by using a connection pooling tool called PGBouncer. In addition to reducing the overhead involved with creating connections inside of PostgreSQL, PGBouncer also allows aliasing the database name. This means that some devices can connect to our database using the database name postgres while others can connect using the database name coins.

Database port

Another one of the poor design decisions from back in 2010 was to use a non-standard port for PG. I believe that this was a security through obscurity decision. Not only does the obscurity cause issues with our own configuration, it pprovides no additional security against anyone who is able to port-scan on our network. Any security benefit that it might have given us is void as soon as I publish this article.

Changing the port is subject to the same pitfalls mentioned above, so we need a way to support both the legacy port and the new port simultaneously while we carefully update all devices. This can be accomplished using port forwarding within the database server

Hostname

Just to be consistent with our latest server naming convention, the production database should be called proddbcoin. Since we use static IP assignments in our DNS, this should be easy: We can direct all legacy and current hostnames to the same IP, allowing us to slowly migrate devices to the new hostname. In fact, most devices uses a public IP address to connect to our database, since they are not within our private network.

Connection Pooling

I went over this a little in the database name section. The connection pooling approach prevents the overhead involved in creating a new connection each time a device, or our PHP server needs one. I also allows us to alias the database name for a smooth transition away from using the postgres database. Finally, it offers the benefits typically associated with a reverse proxy: the possibility of load ballancing across multiple servers, or switching the servers out behind the connection pool without interrupting service at all.

Summary

The new COINS production database setup may seem a bit more complex than the one it is replacing, and it is. However, all of these complex pieces are being provisioned and configured using Ansible, so the steps can easily be repeated and tweaked.

Here is a diagram showing how both old and new connections strings can reach the same databse: network.png

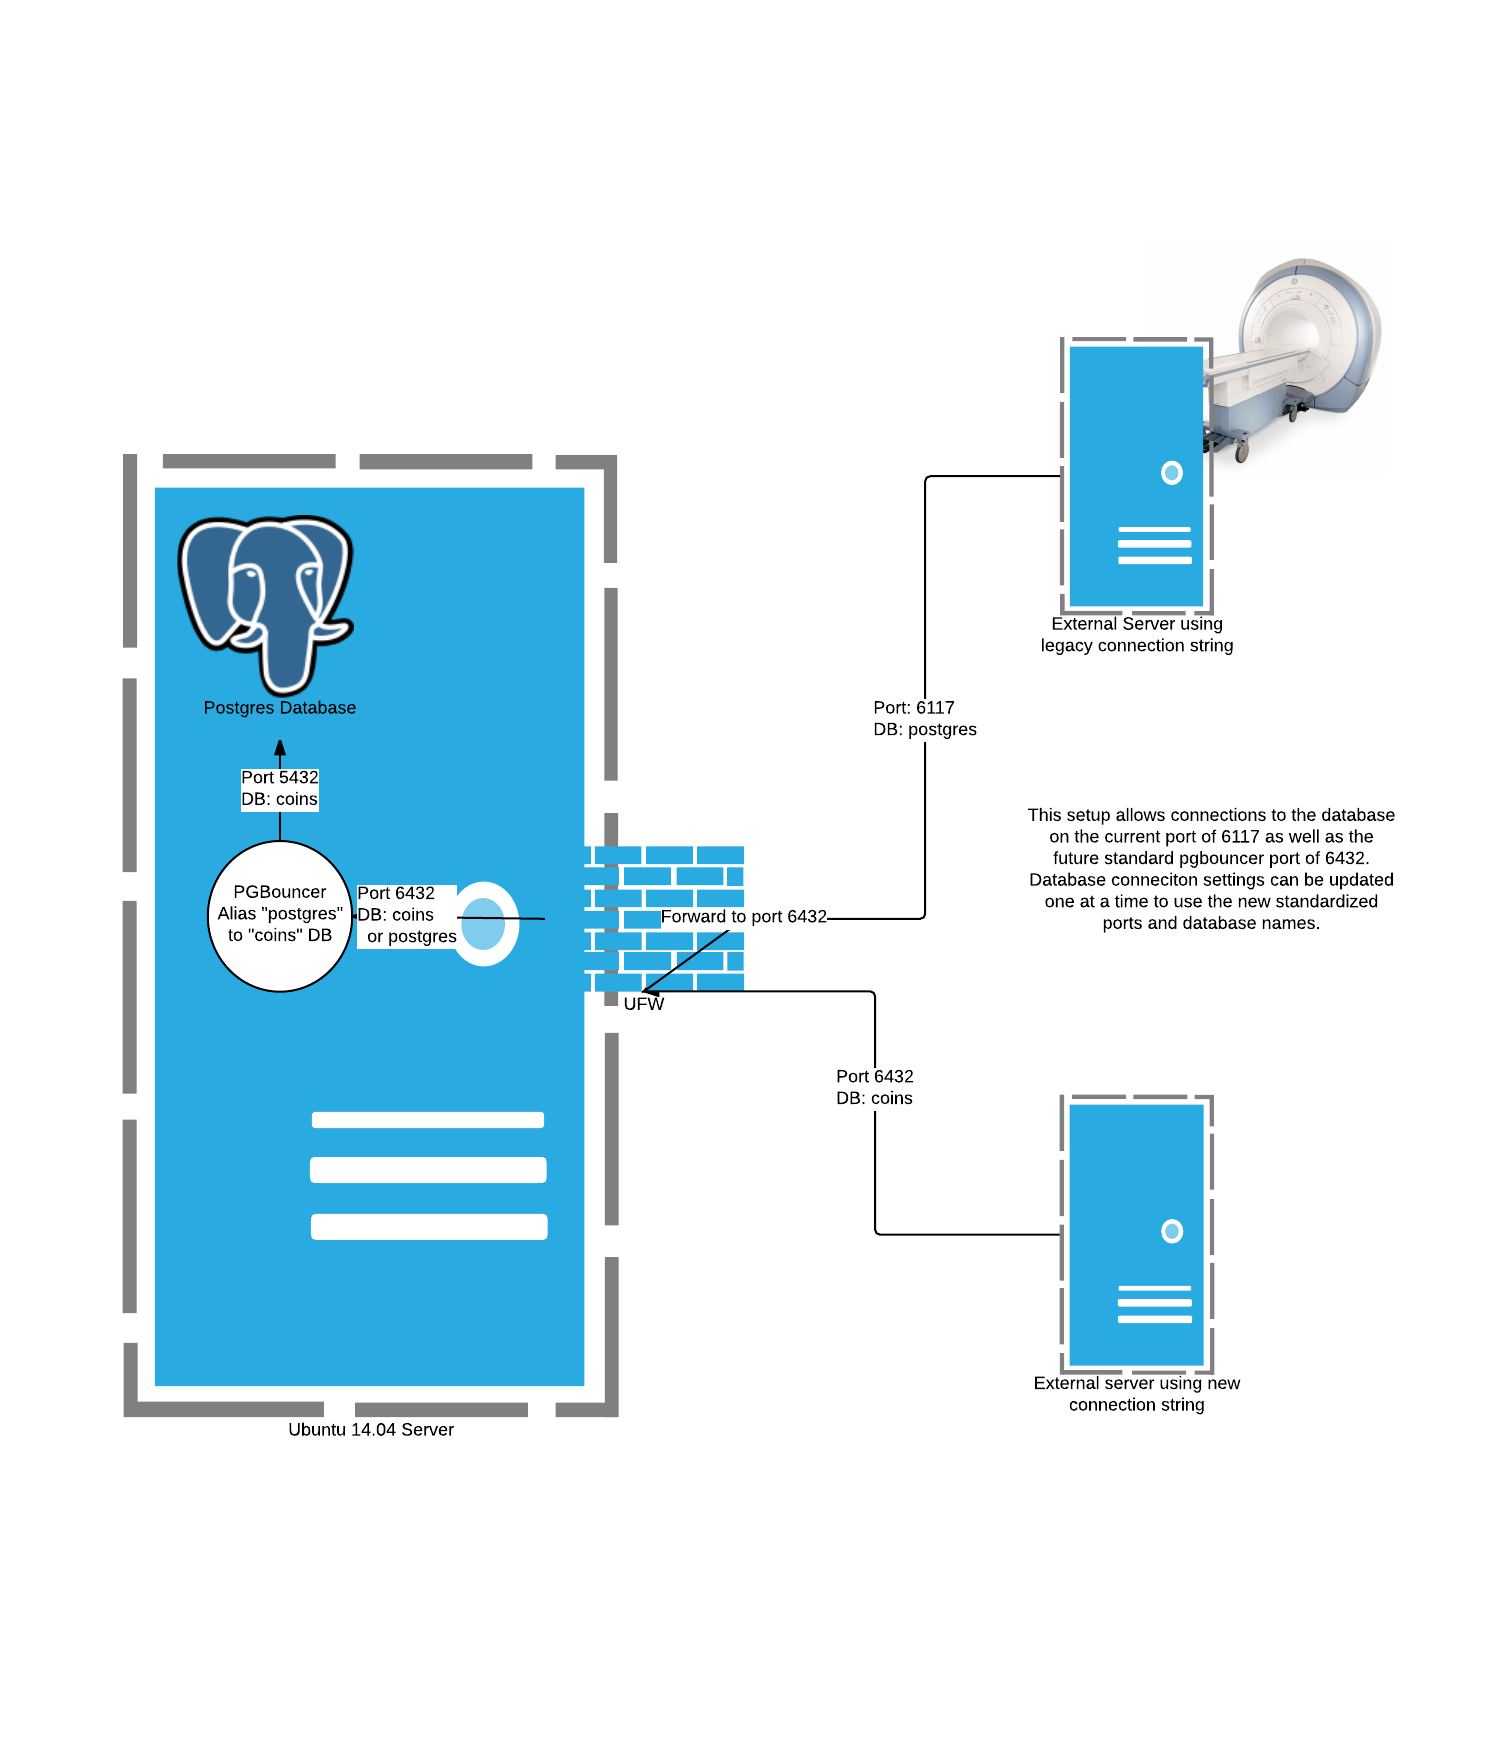
The database is slated to be replaced on Wednesday, June 17th. I will be practicing the deployment using Ansible in our staging environment until then

Why a blog

Dylan Wood

Why am I doing this?“ I try to ask myself this question at least once per hour while I am working to be sure that I am doing something that will contribute to our team’s goals.
Consequently, it makes sense to ask (and answer) this question now. There are a few justifications that come to mind.

Internal communication and continuity

When working on a new project or feature, one of our team members will usually create a Google Doc, presentation or simple email that explains the design decisions made.
However, because there are a variety of venues for sharing this information (Gmail, Google Drive, Gitter, to name a few), it can be difficult to find it again later.
If this blog idea catches on with the rest of the team, this could become the centralized place to document design decisions.

Sharing with the community

Many of the problems that we solve every day are not neuroimaging-specific. Instead, they are problems that web application engineers from all sorts of industries are faced with daily.
By placing our best practices and lessons learned in a public place, we may be able to help others avoid pitfals that we’ve already succumb to.
Further, as COINS becomes more open source, this blog may be the place that community contributers will look to find COINS-specific technical information.

The team that I work with does some pretty cool stuff, and I am excited that we will all be able to share it with anyone who is interested.

Reflection

Writing things down is a great way to process them. I have uncovered countless bugs by just documenting and justifying my changes.

Ok, now on to the first real post (Standardizing our PostgreSQL instances)…